Performance Workbench Intelligent Performance Management Studio for JMeter
Performance Workbench is a unified, browser-based performance testing and management platform that extends the power of Apache JMeter with enterprise-grade control, automation, analytics, and collaboration.
It enables teams to configure, execute, monitor, analyze, and report performance tests from a single, centralized interface, accelerating performance validation across the delivery lifecycle.
Performance Workbench Core Capabilities
Test Management & Execution
Configure, execute, and monitor performance load tests seamlessly in a centralized system, with support for parallel and sequential execution, dynamic parameter files, scheduled runs, and customizable pass/fail criteria for each performance run.
Test Management & Execution
Configure, execute, and monitor performance load tests seamlessly in a centralized system, with support for parallel and sequential execution, dynamic parameter files, scheduled runs, and customizable pass/fail criteria for each performance run.
JMeter Integration
Deep integration with JMeter allows full configuration of scripts including Thread Groups, Listeners, and Non-HTML resources. Initiate test runs via Jenkins using simple web service calls for seamless CI/CD integration.
JMeter Integration
Deep integration with JMeter allows full configuration of scripts including Thread Groups, Listeners, and Non-HTML resources. Initiate test runs via Jenkins using simple web service calls for seamless CI/CD integration.
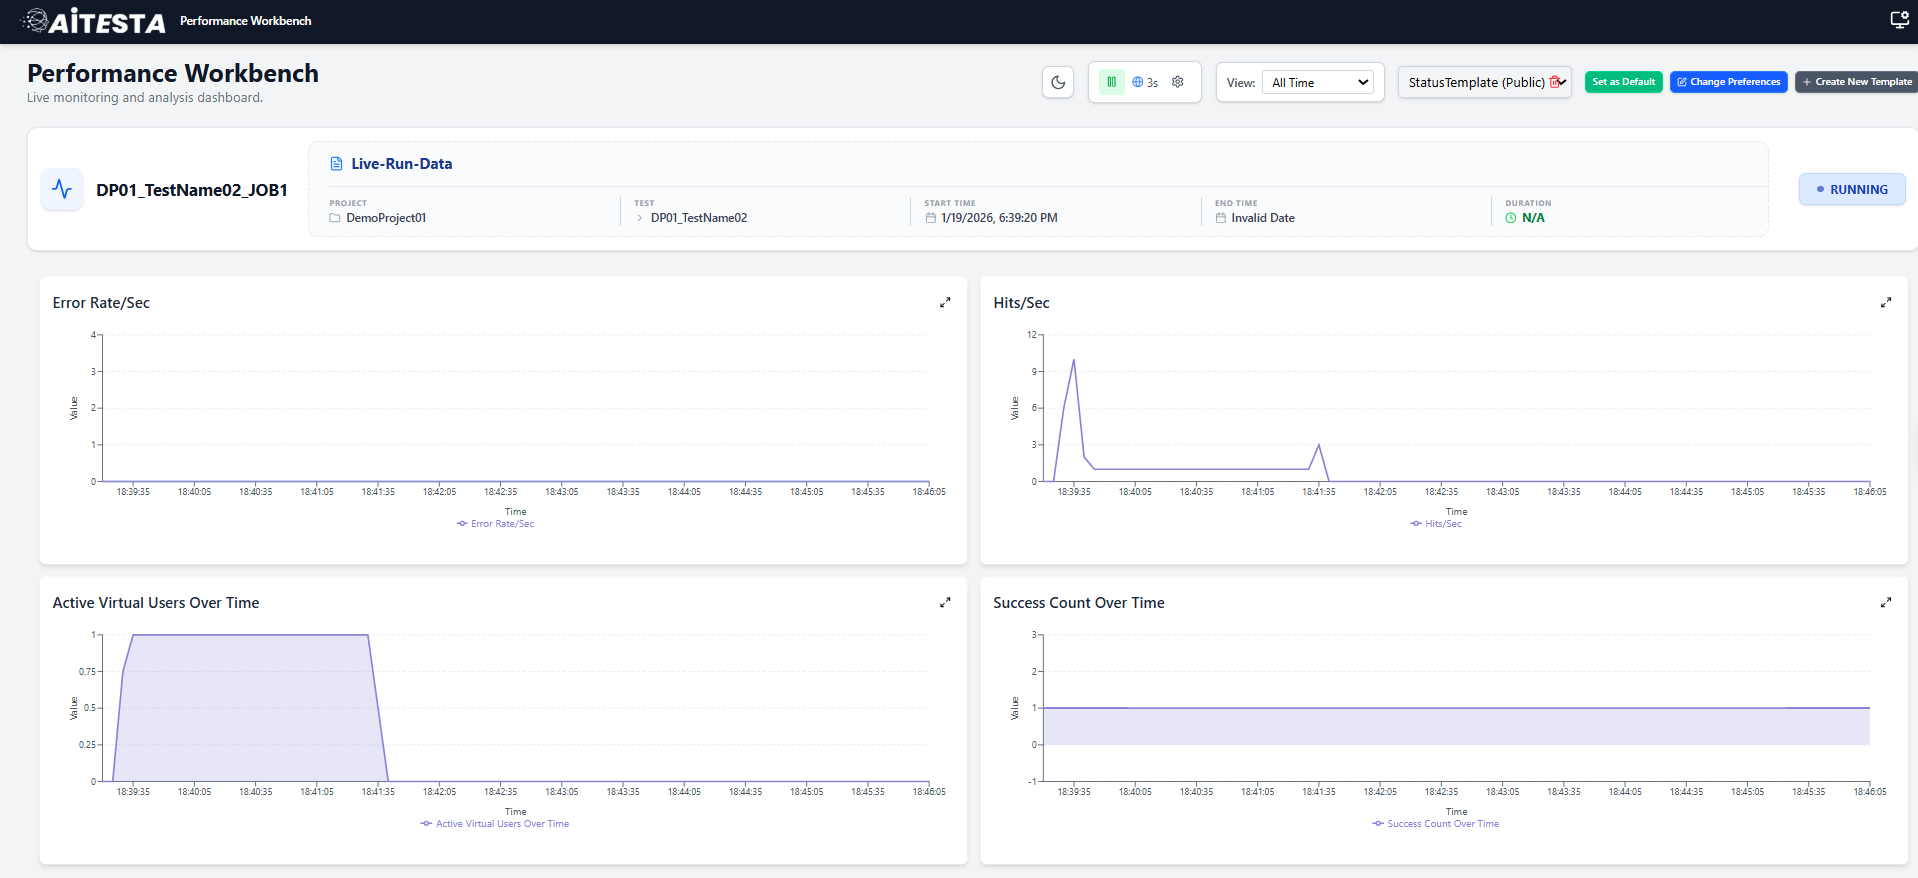
Monitoring & Analysis
Real-time monitoring of virtual users, hits per second, transactions per second, throughput, and more. Plugin support for system, database, and service monitoring for detailed insights to optimize performance. Early detection of performance degradation
Monitoring & Analysis
Real-time monitoring of virtual users, hits per second, transactions per second, throughput, and more. Plugin support for system, database, and service monitoring for detailed insights to optimize performance. Early detection of performance degradation
Reporting
Analyze, compare, and publish performance test results with ease.
Convert JMeter logs into clear, readable HTML summaries.
Merge multiple test reports for consolidated analysis.
Export detailed results in PDF or Word formats.
Reporting
Analyze, compare, and publish performance test results with ease.
Convert JMeter logs into clear, readable HTML summaries.
Merge multiple test reports for consolidated analysis.
Export detailed results in PDF or Word formats.
Custom Dashboard Builder
Build personalized dashboards using drag-and-drop widgets. Monitor real-time performance metrics and KPIs. Define custom performance metrics using queries or functions. Visualize insights through tailored, role-specific dashboards
Custom Dashboard Builder
Build personalized dashboards using drag-and-drop widgets. Monitor real-time performance metrics and KPIs. Define custom performance metrics using queries or functions. Visualize insights through tailored, role-specific dashboards
Dashboards, graphs & visualization
Visualize transaction-level breakdowns using dynamic graphs.
View live graphs for any test run in a separate browser tab.
Create customized public or private dashboards.
Apply flexible filters to focus on key metrics and insights.
Dashboards, graphs & visualization
Visualize transaction-level breakdowns using dynamic graphs.
View live graphs for any test run in a separate browser tab.
Create customized public or private dashboards.
Apply flexible filters to focus on key metrics and insights.
Notifications & Alerts
Automatically notify relevant teams via email or integrated communication tools with real-time status updates during test execution. Configure custom alerts for test milestones, anomalies, or threshold violations to ensure immediate response to performance issues.
Notifications & Alerts
Automatically notify relevant teams via email or integrated communication tools with real-time status updates during test execution. Configure custom alerts for test milestones, anomalies, or threshold violations to ensure immediate response to performance issues.
Calendar-Based Test Scheduling
Visual scheduler for planning test runs and timelines.
Optimize resource allocation across teams and projects.
Improve coordination and visibility across multiple projects.
Calendar-Based Test Scheduling
Visual scheduler for planning test runs and timelines.
Optimize resource allocation across teams and projects.
Improve coordination and visibility across multiple projects.
AI-Powered Test Insights
AI-driven analysis to identify bottlenecks and performance degradation.
Detect patterns and anomalies across test runs.
Enable proactive optimization before production impact.
AI-Powered Test Insights
AI-driven analysis to identify bottlenecks and performance degradation.
Detect patterns and anomalies across test runs.
Enable proactive optimization before production impact.
Project Explorer
List of projects to navigate
View Projects
Configure JMeter scripts
Trigger JMeter Runs and Compare Results
Send E-mail
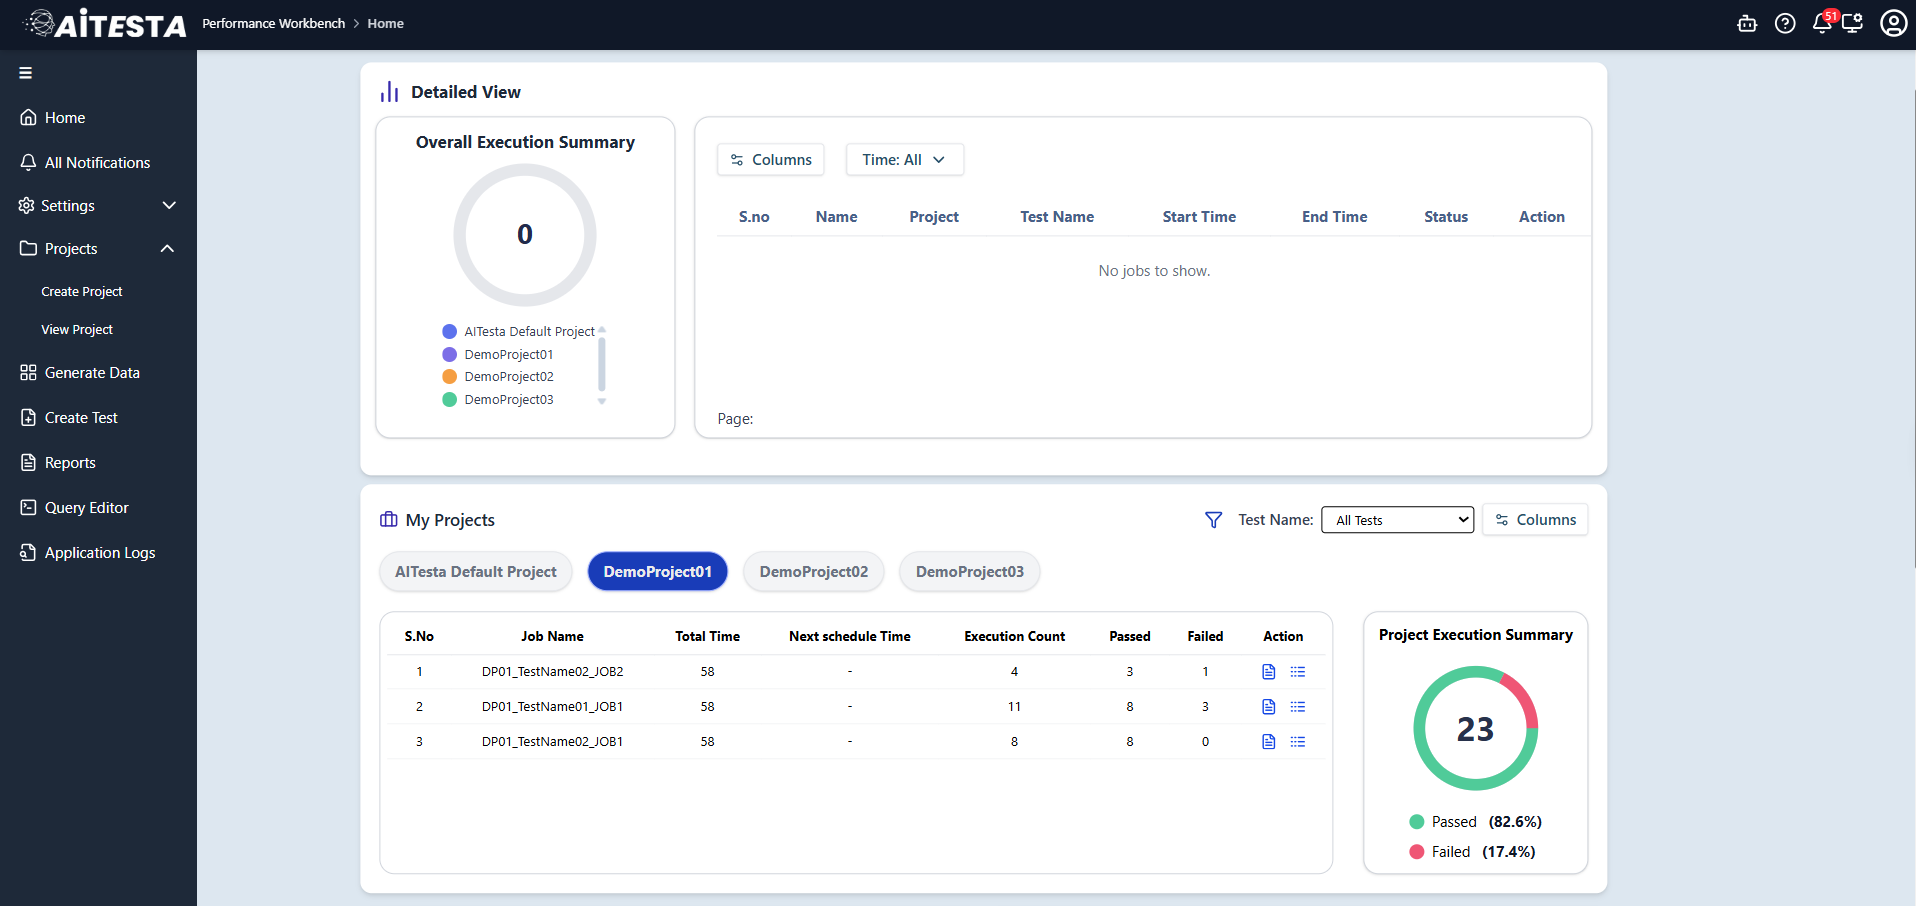
Personalized Dashboards
List of projects to navigate